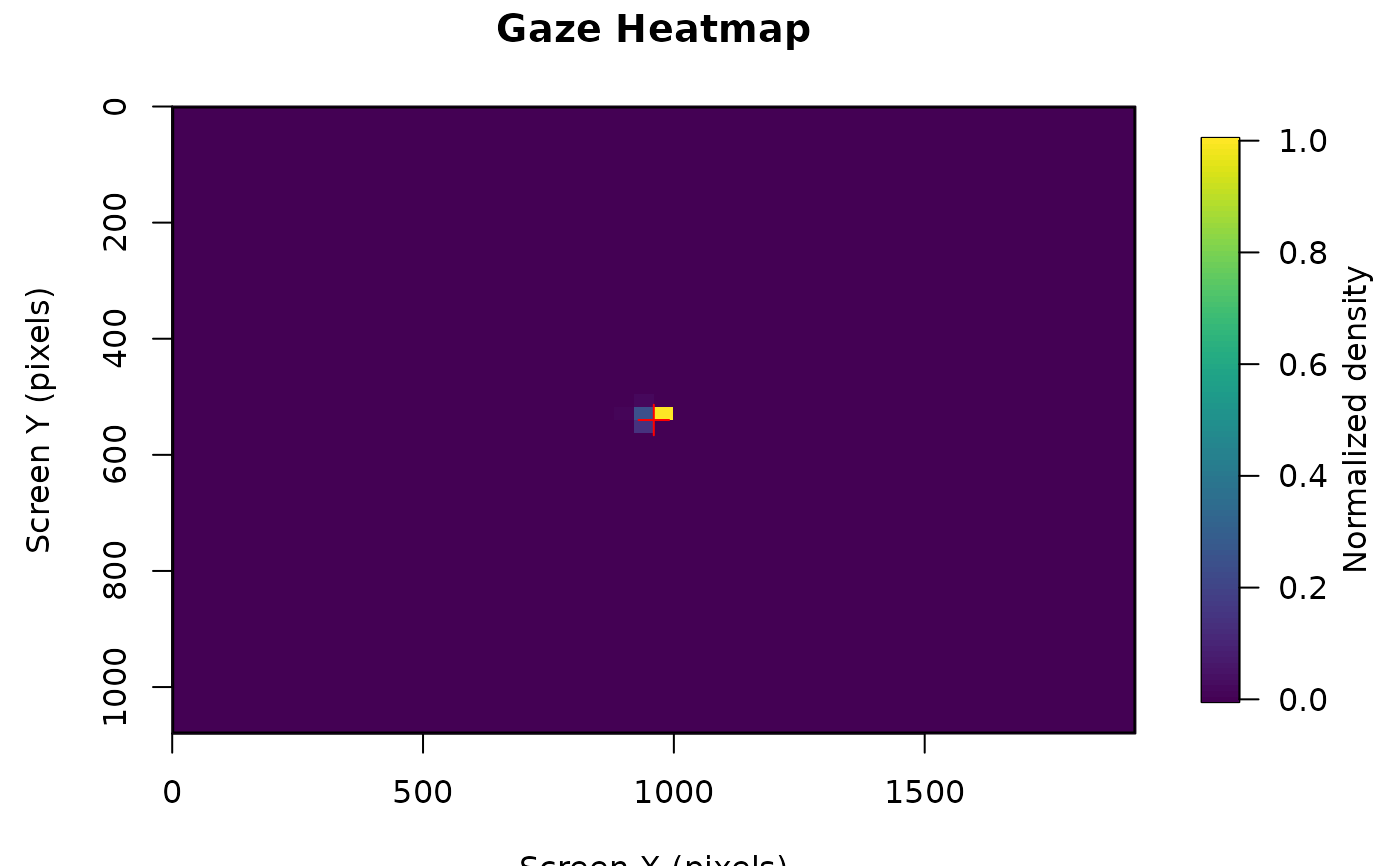
Creates a heatmap showing the distribution of eye_x and eye_y coordinates across the entire screen area. The heatmap shows where the participant looked most frequently during the recording period.
Usage
plot_gaze_heatmap(
  eyeris,
  block = 1,
  screen_width = NULL,
  screen_height = NULL,
  n_bins = 50,
  col_palette = "viridis",
  main = "Gaze Heatmap",
  xlab = "Screen X (pixels)",
  ylab = "Screen Y (pixels)",
  sample_rate = NULL
)
Arguments
- eyeris
An object of class
eyerisderived fromload_asc()- block
Block number to plot (default: 1)
- screen_width
Screen width in pixels from eyeris$info$screen.x
- screen_height
Screen height in pixels from eyeris$info$screen.y
- n_bins
Number of bins for the heatmap grid (default: 50)
- col_palette
Color palette for the heatmap (default: "viridis")
- main
Title for the plot (default: "Fixation Heatmap")
- xlab
X-axis label (default: "Screen X (pixels)")
- ylab
Y-axis label (default: "Screen Y (pixels)")
- sample_rate
Sample rate in Hz (optional)
Examples
demo_data <- eyelink_asc_demo_dataset()
eyeris_preproc <- glassbox(demo_data)
#> ✔ [ OK ] - Running eyeris::load_asc()
#> ℹ [ INFO ] - Processing block: block_1
#> ✔ [ OK ] - Running eyeris::deblink() for block_1
#> ✔ [ OK ] - Running eyeris::detransient() for block_1
#> ✔ [ OK ] - Running eyeris::interpolate() for block_1
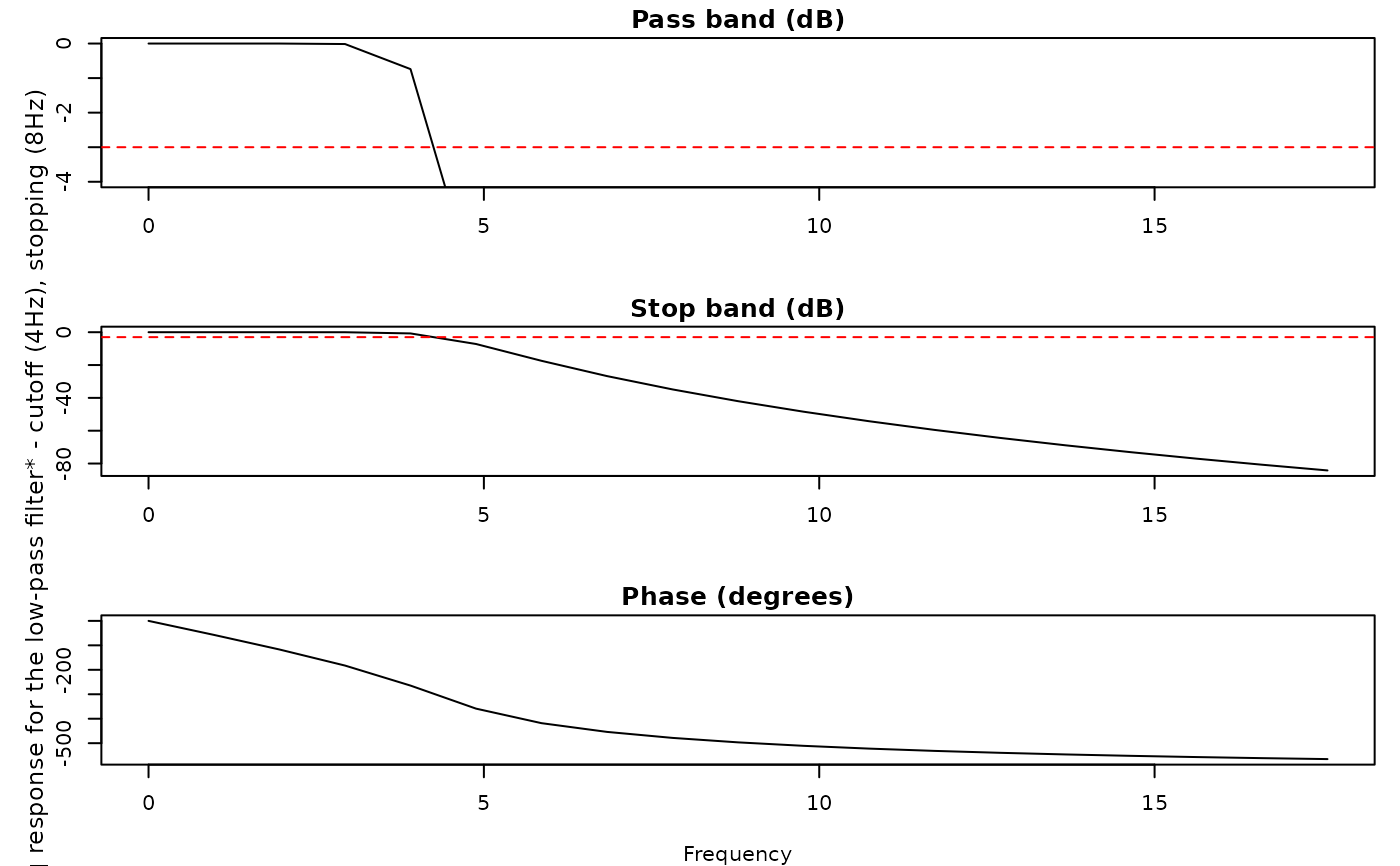
#> ✔ [ OK ] - Running eyeris::lpfilt() for block_1
 #> ! [ SKIP ] - Skipping eyeris::downsample() for block_1
#> ! [ SKIP ] - Skipping eyeris::bin() for block_1
#> ! [ SKIP ] - Skipping eyeris::detrend() for block_1
#> ✔ [ OK ] - Running eyeris::zscore() for block_1
#>
#> Block processing summary:
#> block_1: OK (steps: 6, latest: pupil_raw_deblink_detransient_interpolate_lpfilt_z)
#>
#> ✔ [ OK ] - Running eyeris::summarize_confounds()
plot_gaze_heatmap(eyeris = eyeris_preproc, block = 1)
#> ! [ SKIP ] - Skipping eyeris::downsample() for block_1
#> ! [ SKIP ] - Skipping eyeris::bin() for block_1
#> ! [ SKIP ] - Skipping eyeris::detrend() for block_1
#> ✔ [ OK ] - Running eyeris::zscore() for block_1
#>
#> Block processing summary:
#> block_1: OK (steps: 6, latest: pupil_raw_deblink_detransient_interpolate_lpfilt_z)
#>
#> ✔ [ OK ] - Running eyeris::summarize_confounds()
plot_gaze_heatmap(eyeris = eyeris_preproc, block = 1)